(function(h,o,t,j,a,r){ h.hj=h.hj||function(){(h.hj.q=h.hj.q||[]).push(arguments)}; h._hjSettings={hjid:3011767,hjsv:6}; a=o.getElementsByTagName('head')[0]; r=o.createElement('script');r.defer=1; r.src=t+h._hjSettings.hjid+j+h._hjSettings.hjsv; a.appendChild(r); })(window,document,'https://static.hotjar.com/c/hotjar-','.js?sv=');

The Complete Guide to Core Web Vitals (2025 Updated)

Published on April 14, 2025
Last Updated on June 18, 2025

Written by

Maya Angelou

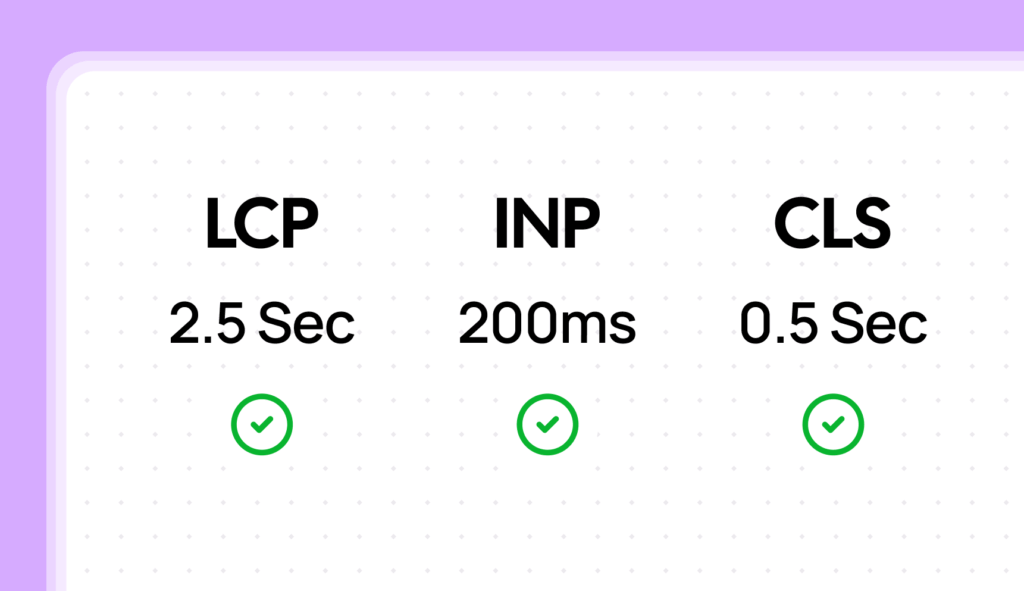
Website performance isn’t just about speed anymore; it’s about the overall experience users have on your site. Google has formalized this with Core Web Vitals, a set of performance metrics that directly measure key aspects of user experience: loading speed, interactivity, and visual stability.

These aren’t just technical guidelines; they represent how real people perceive your website. And because Google uses Core Web Vitals as a ranking signal, mastering them is crucial for both a great user experience and strong search engine optimization (SEO).

This comprehensive guide will break down exactly what Core Web Vitals are, why they matter so much, and how you can optimize your site to achieve excellent scores. We’ll cover each metric in detail, providing practical, actionable advice you can implement today.
The Critical Rendering Path 1

What are Core Web Vitals, and Why the Focus on User Experience?

Core Web Vitals are a set of specific, user-centric performance metrics that Google considers essential for a good web experience. They’re part of a broader effort by Google to provide clear guidance on the quality signals that matter most for website success. Think of them as Google’s way of saying, “These are the things that really annoy users, so fix them!”

Currently, the Core Web Vitals focus on three critical aspects of the user experience:

  • Loading Performance (LCP): How quickly does the main content of your page become visible to the user? This isn’t about the entire page loading; it’s about that crucial first impression.
  • Interactivity (INP): How quickly does your page respond when a user interacts with it? Does clicking a button or filling out a form feel snappy and responsive, or is there a noticeable delay?
  • Visual Stability (CLS): Do elements on your page shift around unexpectedly while it’s loading? This is incredibly frustrating and can lead to accidental clicks and a poor user experience.

It’s important to understand that these metrics are based on field data – data collected from real users visiting your website using Chrome. This is far more accurate than lab data (simulated tests), as it reflects the actual experience of your audience across a range of devices and network conditions.

Check our RapidLoad AI PageSpeed University

The Two Big Reasons Core Web Vitals Matter

Optimizing for Core Web Vitals isn’t just about pleasing Google (although that’s certainly a benefit!). There are two fundamental reasons to prioritize these metrics:

1. User Experience (UX): This is the most important reason. A website that loads quickly, responds instantly, and doesn’t jump around provides a significantly better user experience. This translates to:

  • Lower bounce rates: Users are less likely to leave your site immediately if it loads quickly.
  • Higher engagement: Users are more likely to spend time on your site, explore your content, and interact with your calls to action.
  • Increased conversions: Whether you’re selling products, generating leads, or simply wanting users to read your articles, a good user experience leads to better results.

2. Search Engine Optimization (SEO): Google has explicitly stated that Core Web Vitals are a ranking signal. While good content is still king, websites that meet the recommended Core Web Vitals thresholds have a competitive advantage in search results, especially on mobile. This means more organic traffic and greater visibility for your website.

A Deep Dive into Each Core Web Vital: Understanding and Optimization

Let’s examine each Core Web Vital in detail, covering what it measures, why it’s important, common causes of poor scores, and practical optimization strategies.

Largest Contentful Paint (LCP): Measuring Loading Performance

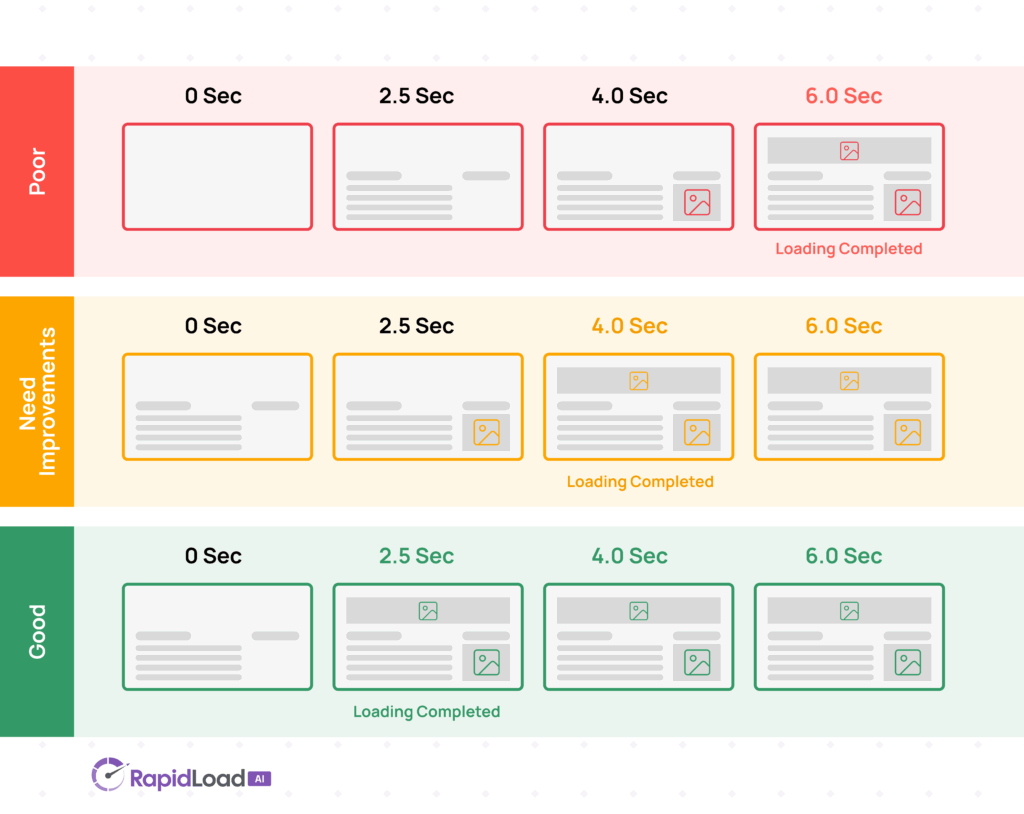
LCP measures the time it takes for the largest content element within the user’s viewport (the visible portion of the page) to become fully visible. This is usually an image, a video, or a large block of text. LCP focuses on the perceived loading speed how quickly does the user feel like the main content has loaded?
LCP
  • Good Score: Under 2.5 seconds
  • Needs Improvement: 2.5 4.0 seconds
  • Poor: Over 4.0 seconds

Common Causes of Poor LCP:

  • Slow Server Response Times (High TTFB): If your server is slow to respond to requests, everything else will be delayed. This is often due to slow hosting, unoptimized databases, or lack of server-side caching.
  • Render-Blocking JavaScript and CSS If the browser has to download and process large CSS or JavaScript files before it can render the main content, LCP will suffer.
  • Slow Resource Load Times: Large images, videos, or other resources that take a long time to download will delay LCP.
  • Client-Side Rendering Issues: If your website relies heavily on client-side JavaScript to render the main content, this can also increase LCP.

Optimization Strategies for LCP:

  • Optimize your server: Choose a fast hosting provider, optimize your database queries, and implement server-side caching.
  • Minimize render-blocking resources: Defer or asynchronously load JavaScript, inline critical CSS, and minimize CSS file sizes.
  • Optimize images: Compress images, use modern image formats (WebP, AVIF), use responsive images (different sizes for different devices), and lazy-load images that are below the fold.
  • Preload important resources: Use the <link rel="preload"> tag to tell the browser to download critical resources (like fonts or the LCP image) early.
  • Use a CDN: A Content Delivery Network (CDN) can significantly reduce the distance data has to travel, improving load times for users around the world.

Learn more about specific techniques in our comprehensive LCP optimization guide for diagnosing and fixing performance issues. (This foundational post covers the first Core Web Vital metric you should master in our PageSpeed University series)

Interaction to Next Paint (INP): Measuring Interactivity

INP measures the responsiveness of your webpage to all user interactions throughout the entire page lifecycle. It replaced First Input Delay (FID) as a Core Web Vital in March 2024 because it provides a much more complete picture of interactivity.

Instead of just measuring the first interaction, INP considers all interactions (clicks, taps, key presses) and reports the longest duration it takes for the browser to visually update the page in response to an interaction. This “next paint” is the crucial visual feedback that confirms to the user that their action has been registered.
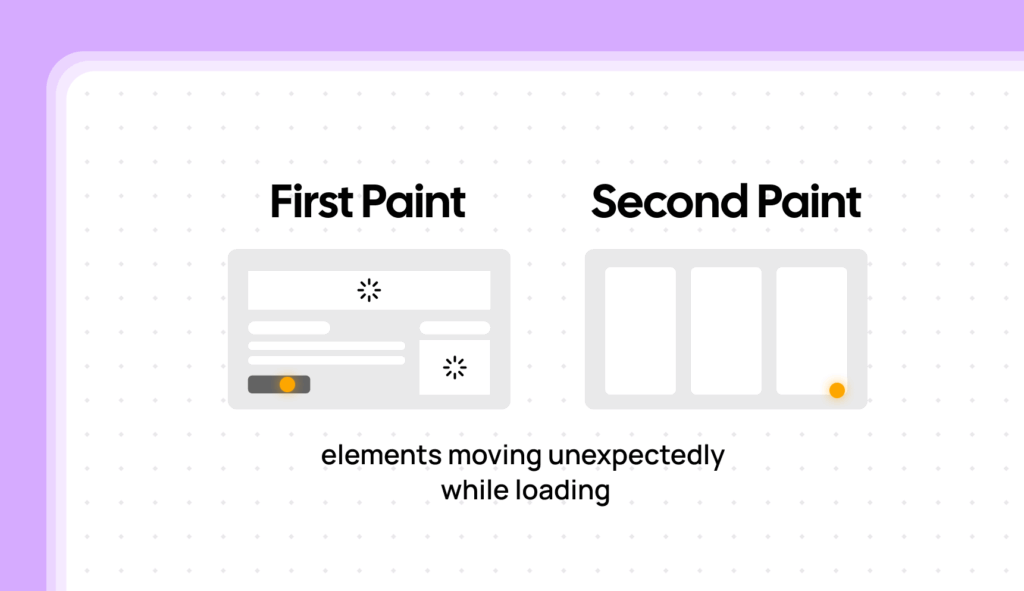
Image Placeholder 3
  • Good Score: Under 200 milliseconds
  • Needs Improvement: 200 500 milliseconds
  • Poor: Over 500 milliseconds

Common Causes of Poor INP:

  • Long Tasks: Long-running JavaScript tasks block the browser’s main thread, preventing it from responding to user input quickly.
  • Large DOM Size: A very large or complex DOM (Document Object Model) can slow down rendering and interaction handling.
  • Main thread Work: Too much things happening on main thread.
  • Inefficient JavaScript Code: Poorly optimized JavaScript code, especially event handlers, can lead to significant delays.
  • Third-Party Scripts: Third-party scripts (analytics, ads, social media widgets) can often contribute to poor INP.

Optimization Strategies for INP:

  • Break up Long Tasks: Use techniques like requestIdleCallback and setTimeout to break up long-running JavaScript tasks into smaller chunks, allowing the browser to handle user input in between.
  • Optimize JavaScript Execution: Defer or asynchronously load JavaScript, use code splitting to load only the necessary JavaScript for each page, and avoid unnecessary JavaScript calculations.
  • Debounce and Throttle Event Handlers: Prevent event handlers from firing too frequently (e.g., on every scroll event), which can overwhelm the browser.
  • Use Web Workers: Move complex calculations or data processing to Web Workers, which run in the background and don’t block the main thread.
  • Minimize Third-Party Script Impact: Audit and optimize your third-party scripts, or consider removing unnecessary ones.

Learn more about specific techniques in our comprehensive INP optimization guide for measuring and improving website responsiveness. (This second post in our PageSpeed University series covers the interactivity Core Web Vital metric)

Cumulative Layout Shift (CLS): Measuring Visual Stability

CLS measures the visual stability of your webpage. It quantifies how much the visible elements on the page shift unexpectedly during loading. These unexpected shifts are jarring and frustrating for users, and they can lead to accidental clicks and a generally poor experience. Imagine trying to read an article, and the text keeps jumping around that’s what a high CLS feels like.
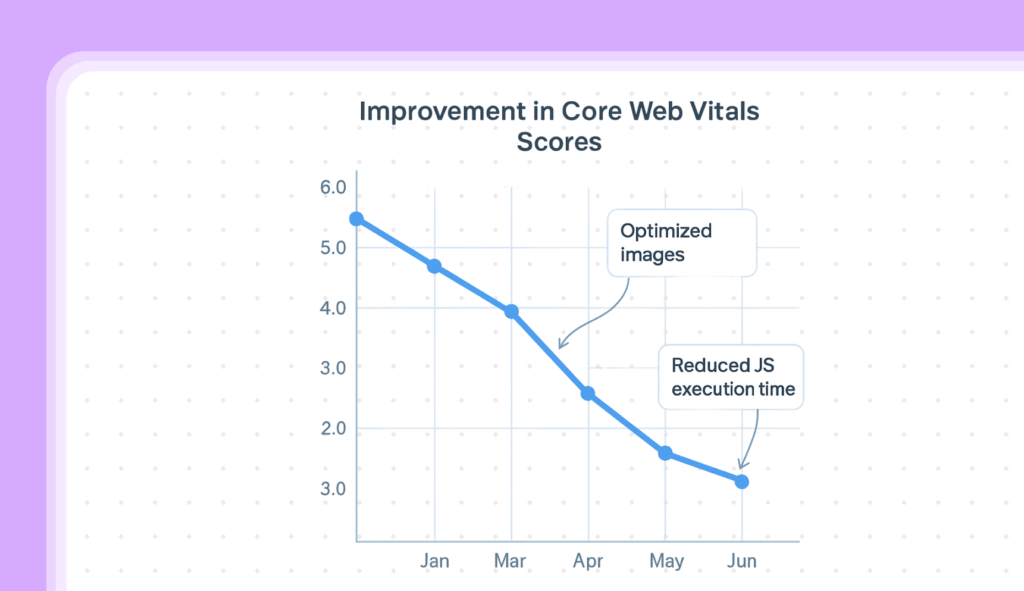
Image Placeholder 4
  • Good Score: 0.1 or less
  • Needs Improvement: 0.1 0.25
  • Poor: Over 0.25

Common Causes of Poor CLS:

  • Images Without Dimensions: If you don’t specify the width and height attributes for your images, the browser doesn’t know how much space to allocate for them until they load. This causes the content below the image to shift down once the image appears. This is the most common cause of CLS.
  • Ads, Embeds, and Iframes Without Dimensions: Similar to images, ads and other embedded content can cause layout shifts if their size isn’t defined beforehand.
  • Dynamically Injected Content: Adding content above existing content (e.g., a notification banner) will push everything else down, causing a shift.
  • Web Fonts Causing FOIT/FOUT: Flash of Invisible Text (FOIT) and Flash of Unstyled Text (FOUT) occur when web fonts take time to load, causing the text to reflow once the font is available.
  • Animations that trigger layout changes: Avoid animating properties like width, height, or margin, as these trigger layout recalculations.

Optimization Strategies for CLS:

  • Always Include Image and Video Dimensions: Set the width and height attributes on your and <video> tags. This is the most important step to prevent CLS.
  • Reserve Space for Ads and Embeds: Use CSS to define the size of ad containers and other embedded content before they load.
  • Avoid Inserting Content Above Existing Content: Unless it’s in direct response to a user interaction, don’t add new content above elements that are already visible.
  • Optimize Web Font Loading: Use the font-display CSS property (e.g., font-display: swap;) to control how fonts are displayed while they’re loading. Preload fonts using <link rel="preload">.
  • Use CSS Transform for Animations: Animate properties like transform and opacity instead of properties that trigger layout changes.

Learn more about specific techniques in our comprehensive CLS optimization guide for diagnosing and achieving visual stability. (This final post in our PageSpeed University series covers the third Core Web Vital metric you should master)

Tools to Measure and Monitor Your Core Web Vitals

You need the right tools to accurately measure your Core Web Vitals and track your progress. Here are some of the most essential:

  • PageSpeed Insights: This free tool from Google provides both lab data (simulated tests) and field data (real-world user data from the Chrome User Experience Report, if available). It gives you specific recommendations for improvement based on your scores.
  • Chrome DevTools: Built directly into the Chrome browser, DevTools offers a powerful suite of performance analysis tools. The Performance panel allows you to record and analyze a page load, identifying bottlenecks in the Critical Rendering Path.
  • Google Search Console: The Core Web Vitals report in Search Console shows you how your website is performing based on field data collected from real users. This is the data that Google uses for ranking purposes.
  • Web Vitals Chrome Extension: This handy extension displays your Core Web Vitals scores in real-time as you browse your website, making it easy to quickly assess performance.
  • Real User Monitoring RUM Tools: These tools (e.g., Google Analytics 4, New Relic, Dynatrace, SpeedCurve) collect performance data from your actual users, providing the most accurate representation of real-world performance across different devices, browsers, and network conditions.

Check out our comprehensive tool comparison guide to find the best Core Web Vitals monitoring solution for your needs.

Setting Realistic Goals and Tracking Your Progress: The Key to Continuous Improvement

Once you’ve measured your current Core Web Vitals, it’s time to set realistic goals for improvement. Don’t aim for perfection immediately. Focus on making incremental progress, prioritizing the areas that will have the biggest impact on user experience and SEO.

Here’s a practical approach:

1. Establish a Baseline: Use the tools mentioned above to get your current Core Web Vitals scores. This is your starting point.

2. Identify Weak Points: Which metrics are furthest from the “Good” thresholds? Which pages or templates are performing the worst?

3. Set SMART Goals:

  • Specific: Target a specific metric on a specific page or template (e.g., “Improve LCP on the homepage”).
  • Measurable: Define a clear target value (e.g., “Reduce LCP from 4.2 seconds to under 2.5 seconds”).
  • Achievable: Set goals that are challenging but attainable within a reasonable timeframe.
  • Relevant: Focus on the metrics that matter most for your website and your users.
  • Time-bound: Set a deadline for achieving your goal (e.g., “within the next three months”).

4. Prioritize: Focus on the changes that will have the greatest impact on user experience. Often, fixing one major issue (like unoptimized images) can significantly improve multiple metrics.

5. Monitor Regularly: Track your progress using the tools mentioned earlier. Don’t just check your scores once; monitor them consistently to see how your optimizations are performing and to catch any regressions.

6. Iterate: Page speed optimization is an ongoing process. Continuously analyze your data, identify new areas for improvement, and refine your strategies.

Learn how to set achievable targets with our Core Web Vitals goal-setting guide for effective progress tracking.

Conclusion: Embrace the User-Centric Approach

Core Web Vitals represent a fundamental shift towards prioritizing user experience in web development and SEO. By understanding and optimizing for these metrics, you’re not just chasing numbers; you’re building a website that is faster, more responsive, and more enjoyable for your users. This, in turn, leads to greater user satisfaction, improved search engine rankings, and ultimately, a more successful online presence. Embrace the user-centric approach of Core Web Vitals, and you’ll be well on your way to creating a website that both users and Google will love

Shakeeb Sadikeen

The expert that experts learn from

About Author

Determined to change that, he built RapidLoad — a smart, AI-driven tool that empowers site owners to dramatically improve speed scores, enhance user experience, and meet Google’s Core Web Vitals without needing to touch a single line of code.
Connect with Shakeeb Sadikeen

Table of content