Core Web Vitals monitoring can make the difference between a high-performing website and one that struggles to retain visitors. While these metrics are crucial for success, the landscape of measurement tools can be overwhelming. This comprehensive guide cuts through the complexity to present the most effective tools and methods for tracking your site’s performance.
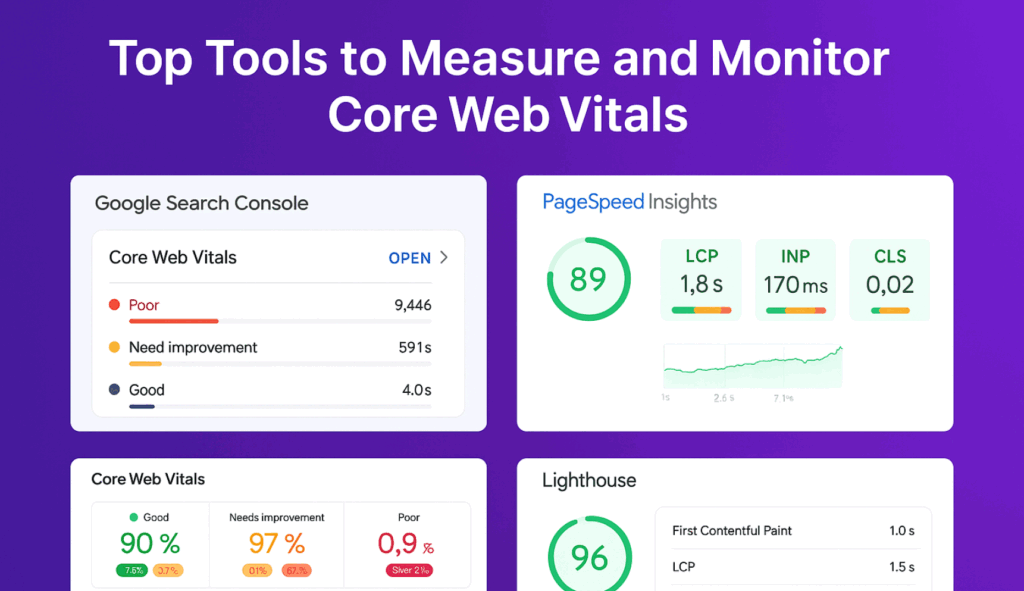
Here’s what we’ll cover:
Essential Measurement Tools
Web performance monitoring has evolved beyond simple page load times. These foundational tools combine real user data with lab testing to give you actionable insights into your site’s Core Web Vitals performance.
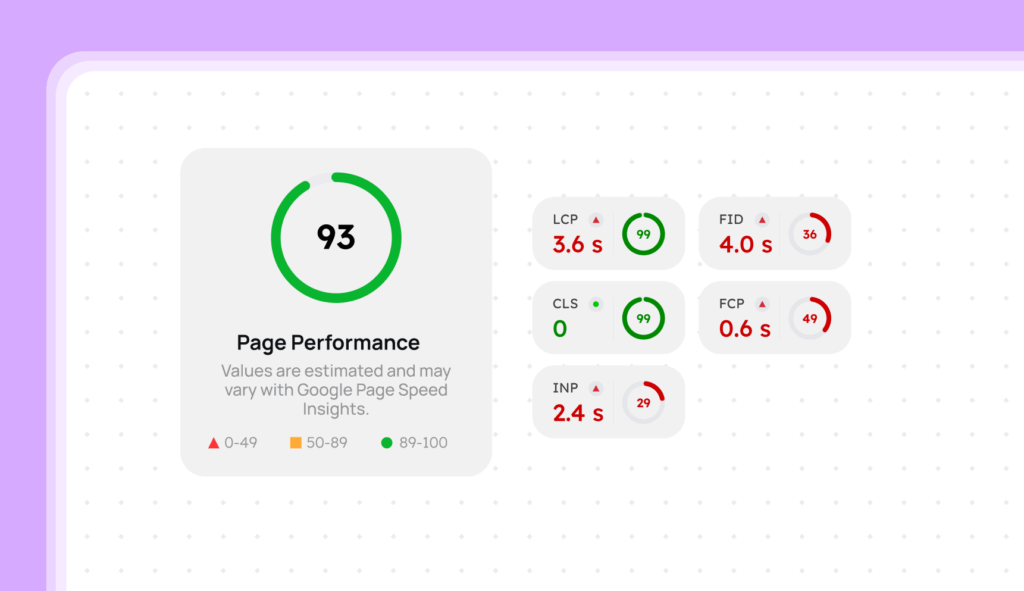
Google PageSpeed Insights
Google PageSpeed Insights combines Chrome User Experience Report (CrUX) data with lab testing to deliver both real-world performance metrics and immediate debugging capabilities in a single interface.
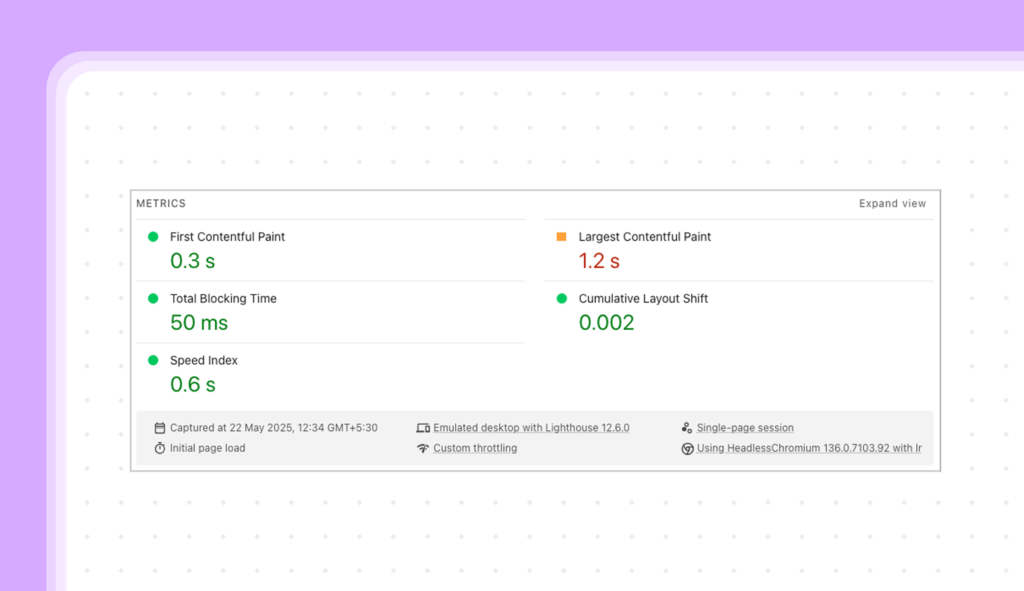
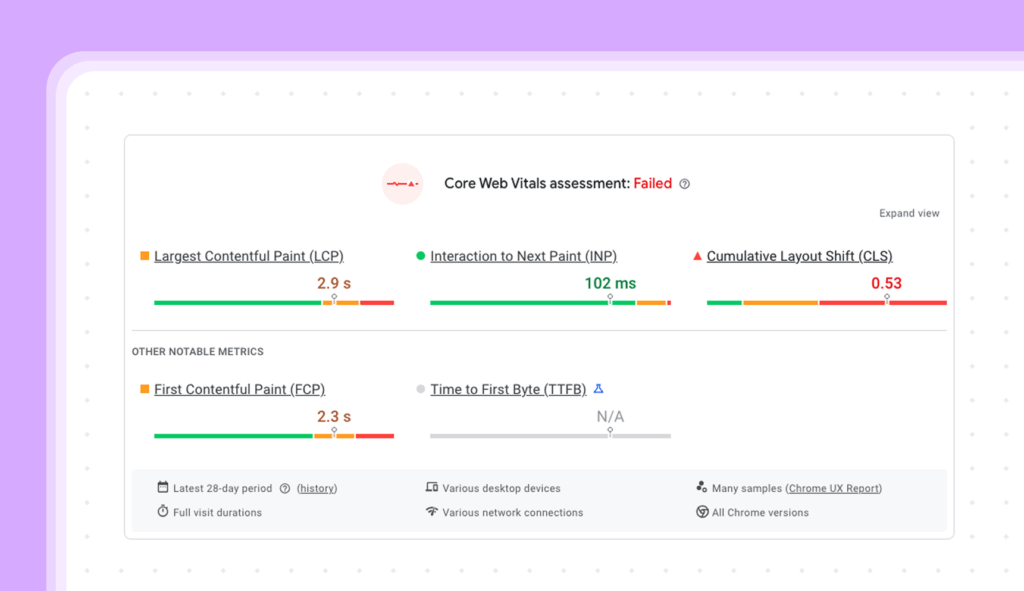
Field Data Analysis
The tool aggregates real-world performance data from the Chrome User Experience Report (CrUX) over the previous 28 days:
Lab Data Features
Provides immediate performance analysis through controlled testing:
Performance Scoring
The tool generates scores on a 0-100 scale across key areas:
|
Score Range |
Performance Rating |
Color Indicator |
|---|---|---|
|
90 – 100 |
Fast |
Green |
|
50 – 89 |
Moderate |
Orange |
|
0 – 49 |
Slow |
Red |
Optimization Recommendations
PageSpeed Insights provides actionable recommendations in three categories:
1. Opportunities
2. Diagnostics
3. Passed Audits
Advanced Features
The tool also offers:
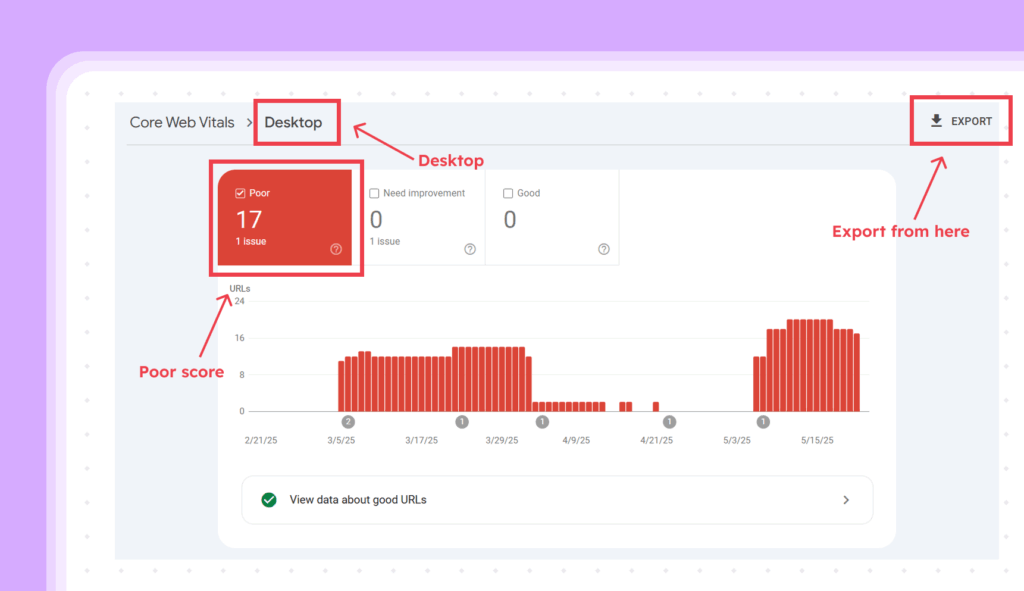
Google Search Console
While PageSpeed Insights focuses on individual URLs, Google Search Console aggregates Core Web Vitals data across your entire site, providing critical insights into performance patterns and trends at scale.
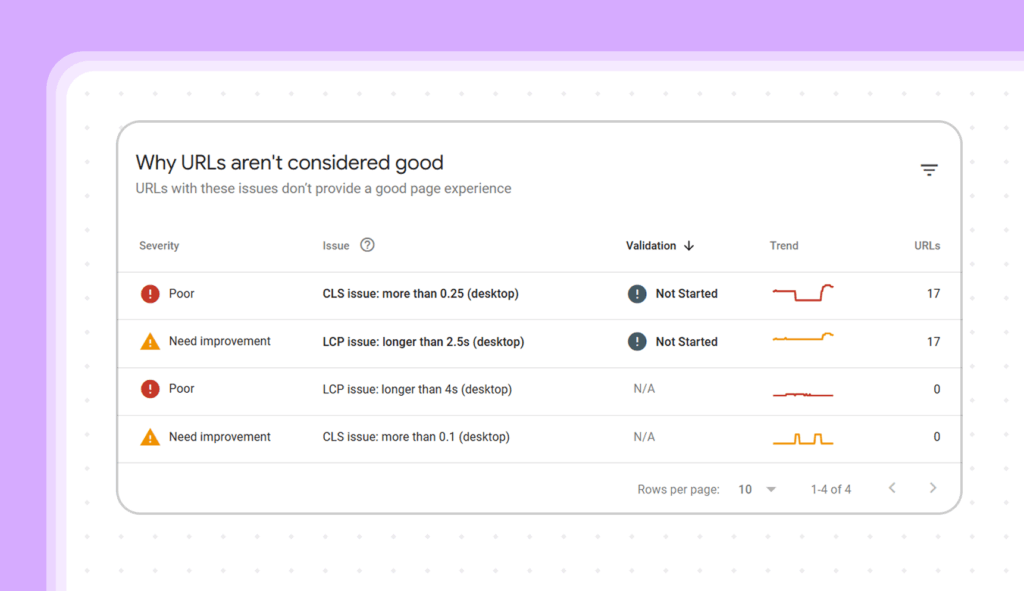
Core Web Vitals Report Structure
The report consists of three main components:
1. Overview Dashboard
2. URL Grouping Analysis
3. Performance Status Categories
|
Status |
Description |
Action Required |
|---|---|---|
|
Good |
Pages passing all Core Web Vitals |
Monitoring only |
|
Needs Improvement |
Pages failing some metrics |
Moderate attention |
|
Poor |
Pages failing multiple metrics |
Immediate attention |
Monitoring Features
1. Historical Data Tracking
2. Issue Detection
3. Mobile vs Desktop Analysis
Validation System
The tool provides a structured validation process:
Integration Benefits
1. Search Performance Correlation
2. Report Sharing
Advanced Features
1. Export Capabilities
2. API Access
Best Practices for Usage
1. Regular Monitoring
2. Issue Management
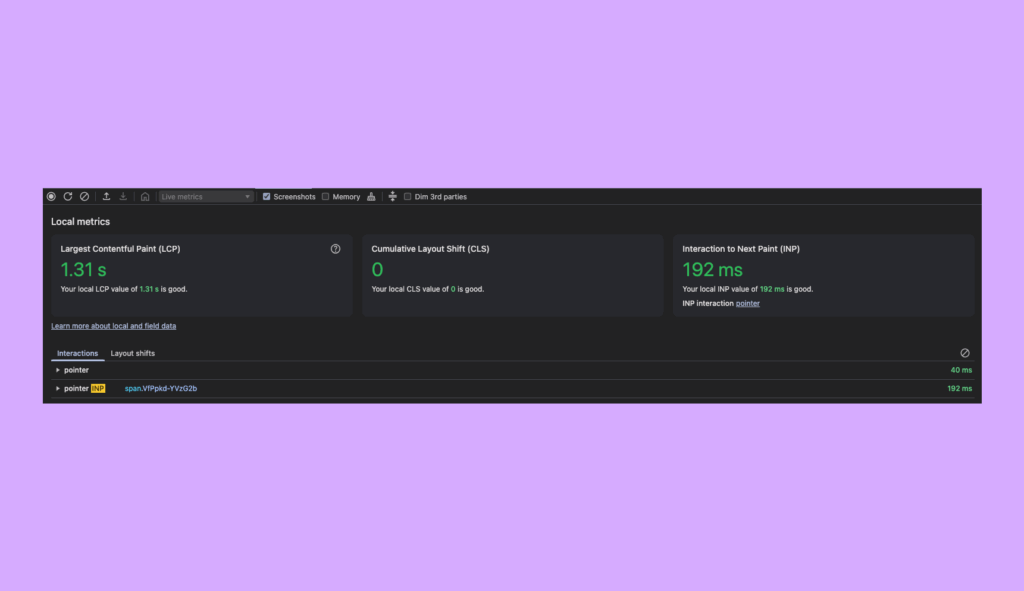
Chrome DevTools
Your surgical instruments for precise performance debugging.
Key Features:
Real User Monitoring (RUM) Solutions
Lab testing can only tell you so much. Real User Monitoring RUM captures actual visitor interactions, revealing performance bottlenecks that synthetic testing might miss.
Popular RUM Tools Comparison
|
Tool Name |
Key Features |
Best For |
Price |
|---|---|---|---|
|
Chrome User |
Real user data, Free, Google |
Basic |
Free |
|
New Relic |
Detailed user sessions, |
Enterprise |
$$$ |
|
Cloudflare Analytics |
Edge analytics, Global data |
CDN users |
$$ |
|
SpeedCurve |
User timing data, |
E-commerce |
$$$ |
Implementation Considerations
1. Data Collection Setup
2. Monitoring Strategy
Lab Testing Tools
When you need to test performance in controlled conditions, these tools are your best friends.
Lighthouse
The industry standard for local performance testing.
Key Features:
WebPageTest
For when you need to dive deep into performance analysis.
Capabilities:
Integration Tools
CI/CD Integration
|
Tool |
Integration Type |
Setup |
Best Use Case |
|---|---|---|---|
|
GitHub |
Automated testing |
Medium |
Continuous |
|
Jenkins |
Pipeline integration |
High |
Enterprise deployment |
|
GitLab CI |
Built-in testing |
Medium |
GitLab projects |
|
CircleCI |
Cloud-based |
Low |
Rapid deployment |
Development Workflow Tools
1. Browser Extensions
2. IDE Plugins
Automated Monitoring
Setting Up Continuous Monitoring
Essential components for automated tracking:
1. Alert System Setup
2. Reporting Automation
Performance Budgets
Performance budgets establish clear thresholds for your website’s Core Web Vitals, helping teams maintain optimal user experience throughout development and deployment cycles.
By setting specific targets for each metric, organizations can proactively identify and address performance regressions before they impact users.
Here’s a comprehensive breakdown of the key performance thresholds that define the health of your web pages.
|
Metric |
Good Target |
Warning Level |
Critical Level |
|---|---|---|---|
|
LCP |
< 2.5s |
2.5-4s |
> 4s |
|
INP |
< 200ms |
200-500ms |
> 500ms |
|
CLS |
< 0.1 |
0.1-0.25 |
> 0.25 |
Advanced Analysis Tools
When basic monitoring tools hit their limits, advanced analysis solutions step in with AI-powered insights, custom metric tracking, and enterprise-grade features that reveal deeper performance patterns.
Custom Monitoring Solutions
1. Web Vitals JavaScript Library
2. Analytics Integration
Enterprise Solutions
Advanced tools for large-scale websites:
|
Solution |
Key Features |
Best For |
Scale |
|---|---|---|---|
|
Dynatrace |
AI-powered analysis |
Enterprise |
Large |
|
Datadog |
Full-stack monitoring |
SaaS |
Large |
|
Pingdom |
Uptime Performance |
Small-Medium |
Medium |
|
GTmetrix Pro |
Detailed analysis |
Developers |
Small-Medium |
Tool Selection Guide
Different websites demand different monitoring approaches. From e-commerce platforms to content-heavy sites, here’s how to build a monitoring stack that matches your specific technical requirements and business goals.
Choosing the Right Tools
Your selection process should begin with a clear assessment of critical factors that influence tool effectiveness for your specific context. Here’s a systematic approach to evaluating and selecting the most appropriate monitoring solutions:
Consider these factors when selecting monitoring tools:
1. Website Type
2. Resource Considerations
Implementation Roadmap
Follow this sequence for tool implementation:
1. Basic Setup
2. Advanced Implementation
Remember: The key to successful Core Web Vitals monitoring is choosing the right combination of tools for your specific needs and consistently tracking performance over time. Start with the essential tools and gradually expand your monitoring capabilities as needed.
Would you like me to expand on any particular section or add more specific details about certain tools ?
